Mobile Project Dashboard: Project Summary
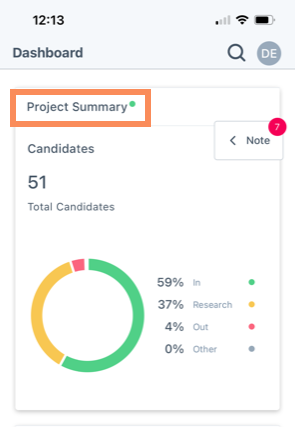
The Project Summary section shows an overview of your Candidate's status. The total number of Candidates is shown and broken out into status percentages for In, Research, Out, and Other. Detailed by corresponding colors in a donut chart.
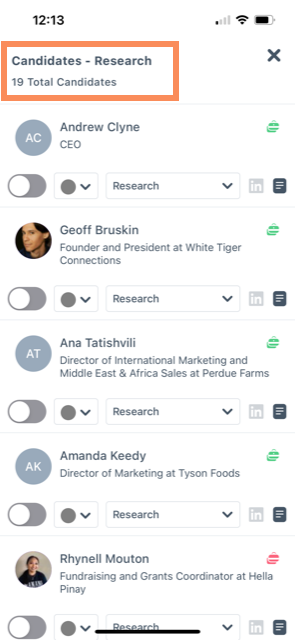
Click on the desired colors (category) on the donut chart to see the number of Candidates within each percentage breakdown. For the purpose of the artilce the Yellow part of the chart was selected.